


Adobe FlashPlayer and your WatchmanOne DataCentre
Watch the video:

First things first...
Despite these changes, your WatchmanOne system is still working. Your data is being recorded and saved in the usual way. You will also still be receiving real time alarms, so there's no need to panic!
The only part of your monitoring system that will have changed is the ability to view graphs. You can no longer access or view graphs on the WatchmanOne web portal. This article will show you a simple hack for working round this, so you can still view data in graph format.
Important: this article is specific to WatchmanOne DataCentre systems. If you have the WatchmanOne MIDI system, please click here.
Here's how you can generate graphs without Flash Player...
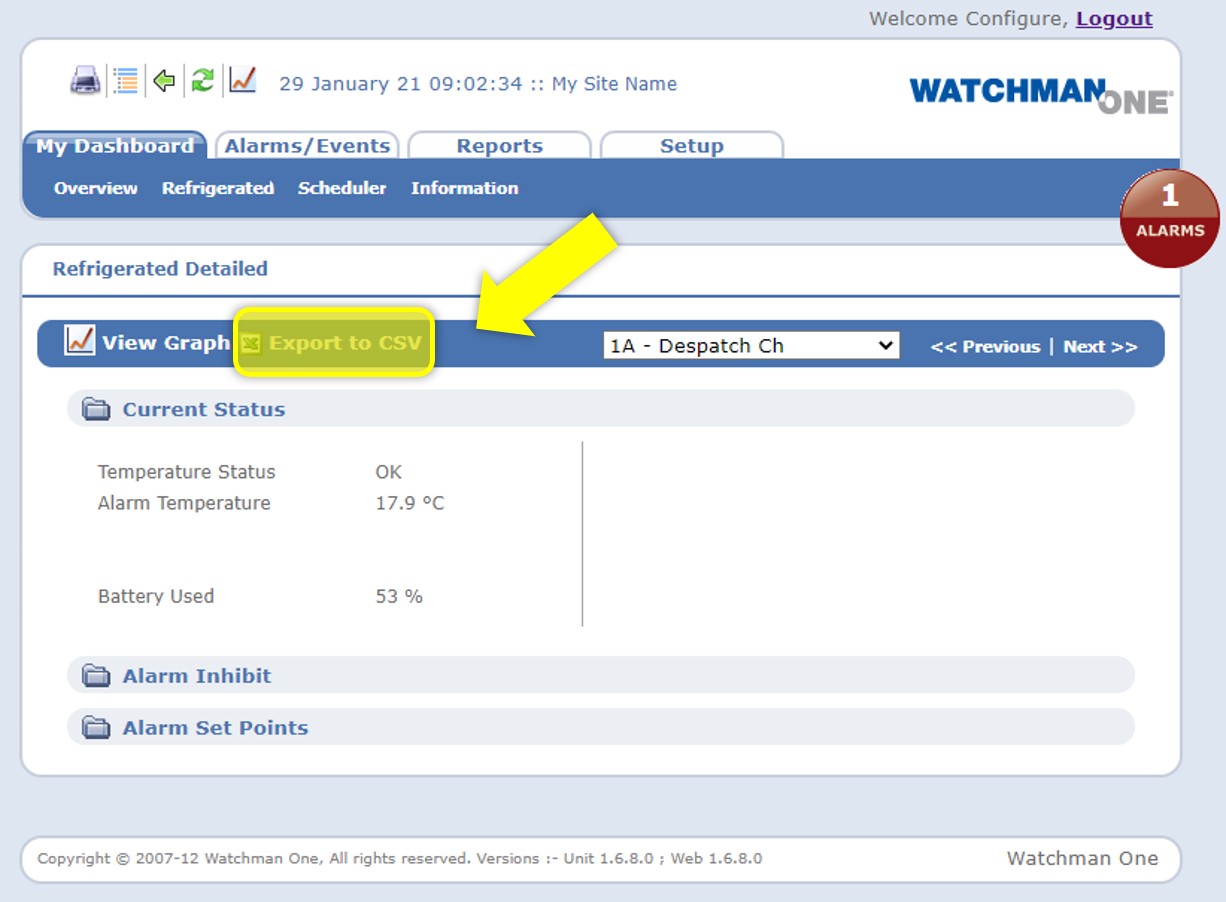
- Instead of selecting ‘view graph’ select ‘export to CSV'.
- Select your Day, Month and Year (11th January 2021 in this example).
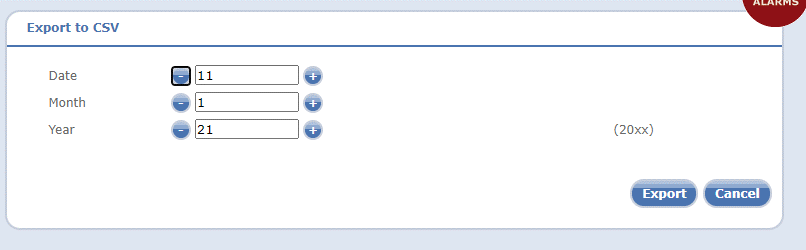
- This will then open a Microsoft Excel document containing all data for that day.
- Click on the top left cell (1A) and highlight/select only the data which you wish to generate a graph for (see image below).
- Then go to ‘Insert’ tab, then under ‘charts’ select ‘insert line chart’.
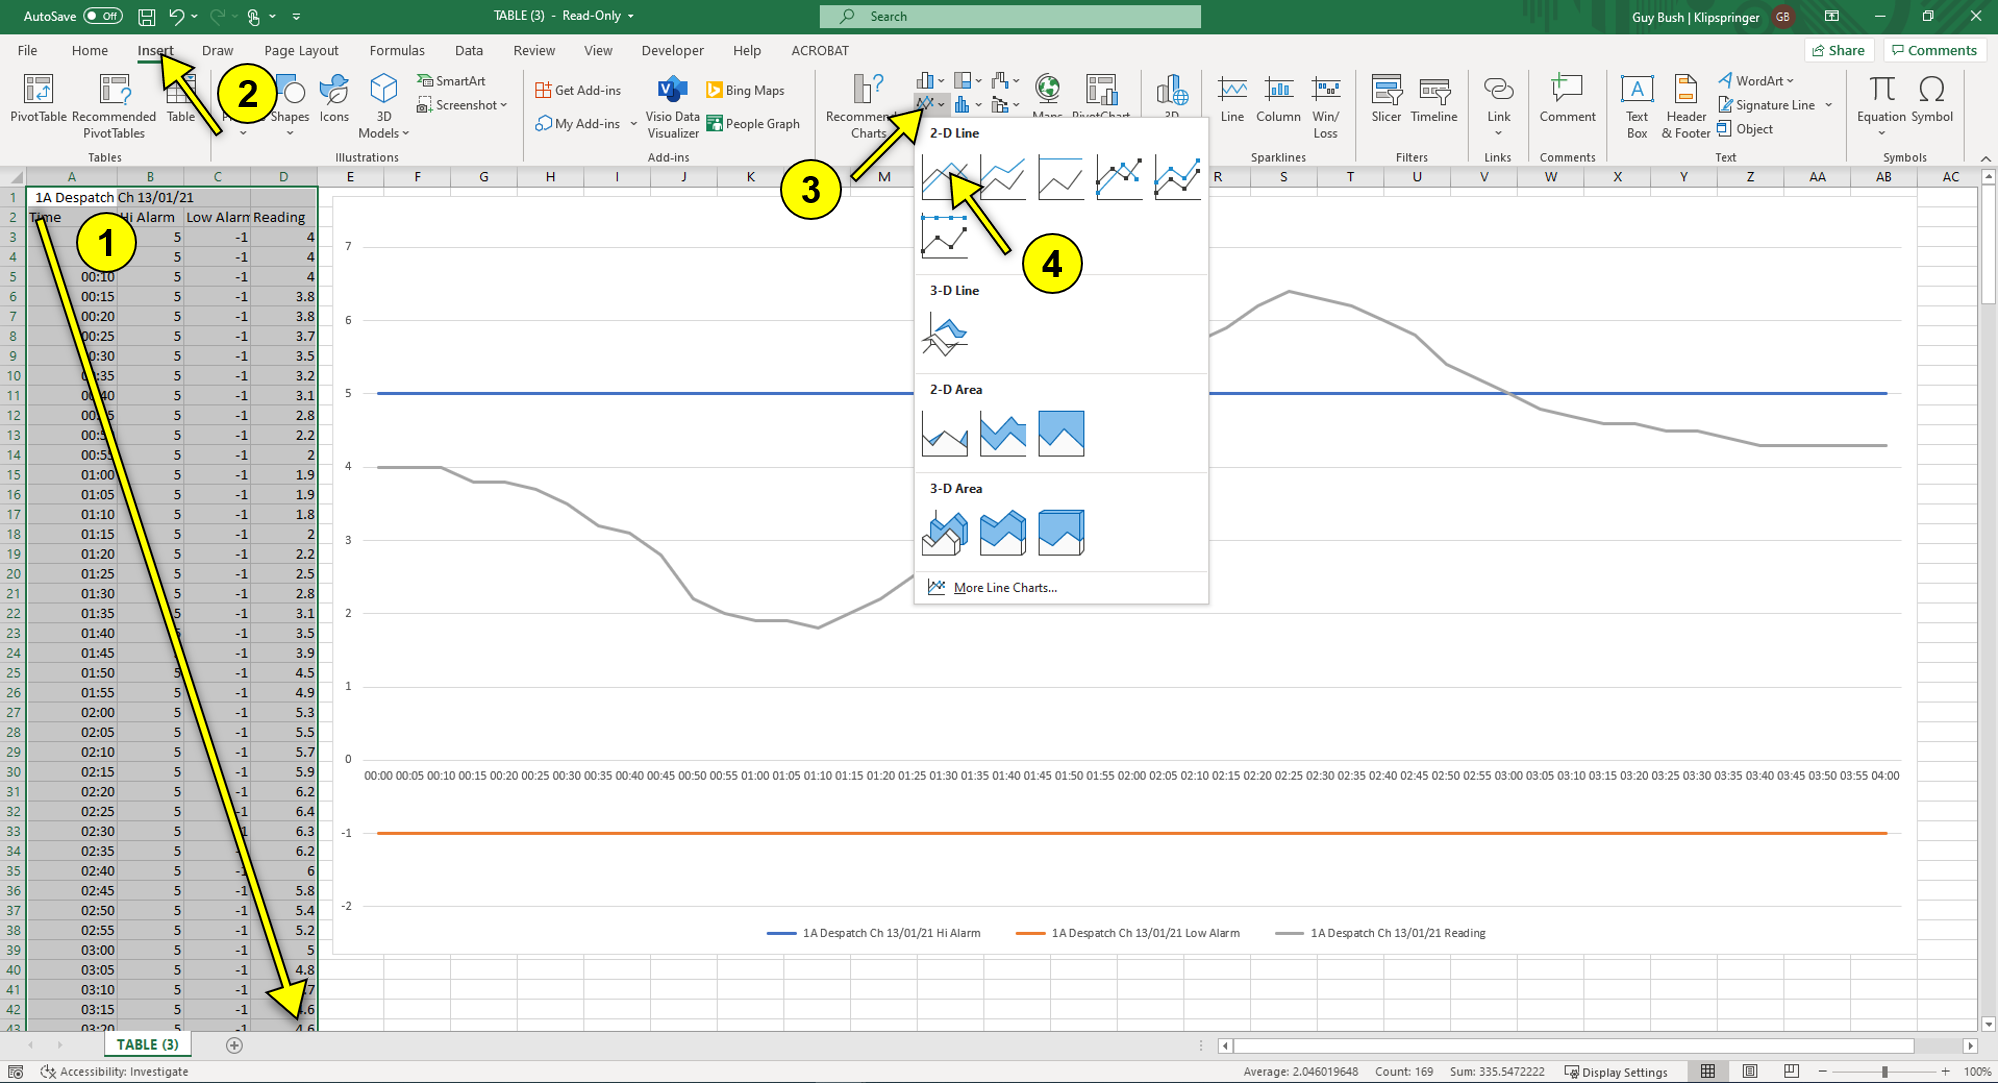
- This will then create a graph which you can view and/or save. Change the view, colour scheme (and other graph design elements) to suit.
Still confused?
Call our technical support team today on 01473 461 800 or email service@klipspringer.com - our team are ready to help you!